 |
| Great grey owl (Creative Commons). |
Preamble
For my previous post on causal diagrams, I made up a fake dataset relating the incidence of COVID-19 to the wearing of protective goggles for hypothetical individuals. The dataset included several related covariates, such as whether the person in question was worried about COVID-19.
The goal of the exercise was to (hypothetically!) determine whether protective glasses was an effective intervention for COVID-19, and to see how accidental associations due to other variables could mess up the analysis.
I faked the data so that COVID-19 incidence was independent of whether the person wore protective goggles. But then I demonstrated, using multivariate regressions, that it is easy to incorrectly conclude that protective glasses are significantly effective for reducing the risk of COVID-19. I also showed how a causal diagram relating the variables can be used to determine which variables to include and exclude from the analysis.
In this article, I'll explain how to recognize the patterns in causal diagrams that lead to statistical confounding, and show how to do a causal analysis yourself.
Here's the entire 'statistical confounding' series:
- Part 1: Statistical confounding: why it matters: on the many ways that confounding affects statistical analyses
- Part 2: Simpson's Paradox: extreme statistical confounding: understanding how statistical confounding can cause you to draw exactly the wrong conclusion
- Part 3: Linear regression is trickier than you think: a discussion of multivariate linear regression models
- Part 4: A gentle introduction to causal diagrams: a causal analysis of fake data relating COVID-19 incidence to wearing protective goggles
- Part 5: How to eliminate confounding in multivariate regression (this post): how to do a causal analysis to eliminate confounding in your regression analyses
-Part 6: A simple example of omitted variable bias: an example of statistical confounding that can't be fixed, using only 4 variables.
Introduction
In A gentle introduction to causal diagrams, I introduced a fake dataset in which rows represented individuals, containing the following information:
- $C$: does the person test positive for COVID-19?
- $G$: does the person wear protective glasses in public?
- $W$: is the person worried about COVID-19?
- $S$: does the person avoid social contact?
- $V$: is the person vaccinated?
I then did some multivariate logistic regressions to answer the following question: does wearing protective goggles help reduce the likelihood of catching COVID-19?
In generating the dataset, I made the following assumptions:
- protective glasses have no direct effect on COVID-19 incidence;
- avoiding social contact has a significant negative effect on COVID-19 incidence;
- getting vaccinated has a very significant negative effect on COVID-19 incidence;
-
being worried about COVID makes a person much more likely to get
vaccinated, avoid social contact, and wear protective glasses;
- being vaccinated makes a person less likely to avoid social contact.
The causal diagram associated with these variables and assumptions is shown below. An arrow from one variable to another indicates that the value of the 'to' variable depends on the 'from' variable.
The exercise in the article was to determine which variables to include
in a multivariate regression, in order to analyze whether protective
glasses reduce the risk of catching COVID-19. The colored nodes are the
ones that were ultimately included; only the $W$ (worried about COVID-19) variable was used as a covariate, in addition to the
dependent and independent variables $G$ and $C$.

Backdoor paths
In the diagram above, the causal relationship we want to assess (between $G$ and $C$) is represented by the gray dashed arrow. But there are a lot of other connections with intermediate variables, in the form of paths in the graph between $G$ and $C$, that can accidentally generate statistical associations between $G$ and $C$.
The first such path is shown below: it passes from $G$ to $W$ to $S$ to $C$. This is called a 'backdoor path' because arrow 1 points into $G$, rather than emitting from $G$. This path can be described in words as follows: if the person is worried about COVID-19, this makes her more likely to both wear protective glasses and socially distance. Since social distancing is an effective intervention against COVID-19, this sets up a negative correlation between wearing glasses and catching COVID-19; but the dataset was constructed so that protective glasses had no impact on COVID-19, so the effect is only due to correlation, not causation.

A second path is shown below: it passes from $G$ through $W$ to $V$ and then to $C$. In words: If a person is worried about COVID-19, he is more likely to both wear protective glasses and to get vaccinated. Since vaccination is an effective intervention against COVID-19, this again sets up a negative correlation between wearing glasses and catching COVID-19.

A third path is shown below: it passes from $G$ through $W$ to $V$, then to $S$ and finally $C$. In words: if a person is worried about COVID-19, she is more likely to get vaccinated, after which she may be less likely to socially distance. This is a problem in our analysis if we do not know the person's vaccination status, since the presence of a lot of people who do not socially distance, and yet do not catch COVID-19, will obscure the effectiveness of social distancing as an intervention. In the presence of enough vaccine-positive people, it might even appear that people who do not socially distance are *less* likely to get COVID-19 if we don't know people's vaccination status!

There is another type of backdoor path to consider, shown below. Backdoor path 4 passes from $G$ to $W$, through $S$ and $V$, to $C$. Backdoor path 4 will not cause confounding unless we make the mistake of conditioning on variable $S$. The variable $S$ is called a collider variable, because it has two arrows in the path pointing into it. We have to be careful not to condition on a collider variable, i.e., not to include it in the multivariable regression.

Patterns of confounding
Each of the backdoor paths in any causal diagram can be broken down into a series of connections among three variables in the path. There are 3 relationships that can occur among these 3 variables: the 'fork' pattern, the 'pipe' pattern, and the 'collider' pattern.
Fork pattern
The image below shows the 'fork' pattern, which occurs in our example among the variables $G, W$, and $S$. The fork occurs when a single variable affects two 'child' variables; in this case, being worried makes a person both more likely to socially distance, and more likely to wear protective glasses.

If three variables are related by the fork pattern, then the two child variables will be marginally statistically dependent, but will be independent if we condition on the parent variable. Mathematically, the fork pattern says that:
$$p(G, W, S) = p(G|W)p(S|W)p(W).$$
Since $p(G,S)=\int p(G|V)p(S|V)p(V) dV$, it follows that $p(G,S)\ne p(G)\cdot p(S)$ in general. However, $p(G,S|V)=p(G|V)\cdot p(S|V)$; in this graph of 3 variables, $W$ and $S$ are conditionally independent given $V$.
In words, this says that if I know whether a person is worried about COVID-19, then knowing whether a person socially distances tells me nothing additional about whether they are likely to wear glasses.
Pipe pattern
The image below shows the 'pipe' pattern, which occurs in our example among the variables $W, S$, and $C$. The pipe occurs when a variable is causally 'in-between' two other variables. In this case, being worried causes a person to socially distance, which in turn reduces their chance of getting COVID-19.

In words, this says that if I know whether a person is avoiding social contact, then knowing whether the person is worried about COVID-19 tells me nothing additional about whether they might have caught it.
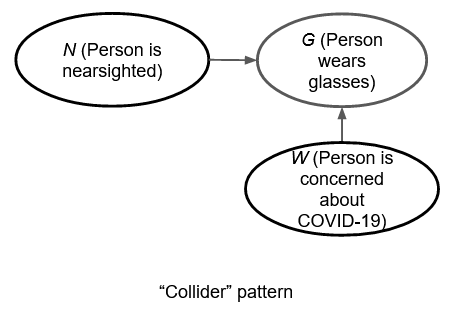
Collider pattern
The collider pattern occurs when a single variable is dependent on two unrelated parent variables. There aren't any simple collider pattern examples in our example causal diagram -- for example, social distancing $S$ is dependent both on $V$ and $W$, but these two variables are also directly related to each other. So I've added an extra random variable in the diagram below: $N$, which is 1 if the person is nearsighted, and 0 otherwise. Clearly, being nearsighted is another reason why someone might wear glasses.
The collider pattern is different from the fork and pipe patterns. In the collider pattern, the two parents of the common child are marginally independent of each other. Mathematically, we have $p(N,W) = p(N)p(W)$ (it follows from the definition of the joint distribution, $p(N,W,G)=p(G|N,W)p(N)p(W)$), but $p(N,W|G)\ne p(N|G)\cdot p(W|G)$ in general. In other words, conditioning the regression on the 'collider variable' $G$ causes the parent variables $N,W$ to become associated. But the association is purely statistical; the two parent variables are still causally unrelated.
To see why this happens, imagine that you know nothing about whether a person wears glasses or not. Then knowing in addition that the person is nearsighted gives you no additional information about whether they are worried about COVID-19.
But suppose that you now know that the person is wearing glasses (i.e., you are conditioning on $G=1$). If you know in addition that the person is not nearsighted, then the odds are higher that they are wearing glasses because they are worried about COVID-19; and if you know that they are not worried about COVID-19, the odds increase that they are wearing glasses because they are nearsighted. So the parent variables become related. Collider bias is sometimes called 'explaining away'; knowing that a person is nearsighted 'explains away' their reason for wearing glasses.
Putting it together
This tells you everything you need to know in order to construct an unconfounded multivariate regression analysis, in order to determine whether one variable has a causal impact on another. The game is to 'block all the backdoor paths', to prevent them from causing accidental correlations between the dependent and independent variables.
For example, consider 'backdoor path 1' at the beginning of the article. This path contains a fork pattern (the variable $W$, pointing to $G$ and $S$) and a pipe pattern (the variable $S$, which is pointed to by $W$, and which points to $C$). If we don't condition on $W$ or $S$, then these variables will set up associations between $G$ and $S$, and between $W$ and $C$; the unbroken line of associations sets up a relationship between $G$ and $C$ that is only a correlation, not causal.
In order to prevent this from happening, we need to condition on either $W$ or $S$. We must choose one of them; conditioning on either one of them will break that chain of association. This is called 'blocking the backdoor path'. But blocking one backdoor path isn't enough; we must block all of them.
Consider backdoor path 2 from $G$ to $C$; it contains a fork variable, $W$, and a pipe variable, $V$. Conditioning on either $V$ or $W$ will block backdoor path 2. Note that conditioning on $W$ will block both backdoor paths 1 and 2, but conditioning on $V$ or $S$ will leave one of the paths unblocked.
Now consider backdoor path 3. Backdoor path 3 contains a fork variable, $W$; a pipe variable, $V$; and another pipe variable, $S$. Conditioning on any of these will block this backdoor path, so again, $W$ will work for this path.
Finally, looking at backdoor path 4, we see that $S$ is a collider variable in this path. Looking at this path in isolation, $W$ and $V$ will be marginally independent of each other. But if we condition on the variable $S$, that will set up an association between $W$ and $V$, which will connect all the variables in backdoor path 4, and cause confounding.
The following shows how the association between $W$ and $V$ can occur, as a result of knowing the value of $S$. Suppose we know for sure that a person is not avoiding social contact (i.e., we have conditioned on $S$). Suppose we also know that this person is worried about COVID-19; then this makes it highly likely that the person is vaccinated, since they would otherwise be avoiding people. Conversely, if we know that a person is not avoiding social contact, and we also know that the person is not vaccinated, then it is highly likely that they just aren't worried about COVID-19.
The fact that $S$ is a collider in this path means that we have to avoid conditioning on $S$ (including it in the regression). Conditioning on it will open backdoor path 4, which would otherwise be blocked.
To summarize, there are 5 total backdoor paths in this diagram -- the four we have discussed, and one other that also contains the variable $S$ as a collider (see if you can find it). Conditioning on $W$ will block the first 3 backdoor paths, and will not accidentally unblock the two paths that contain $S$ as a collider variable. Therefore, a multivariate regression that contains only $W$ as a covariate, $G$ as the independent variable, and $C$ as the dependent variable, will correctly show that wearing glasses has no effect on COVID-19 incidence.


No comments:
Post a Comment